Debugging FlowFuse Dashboard
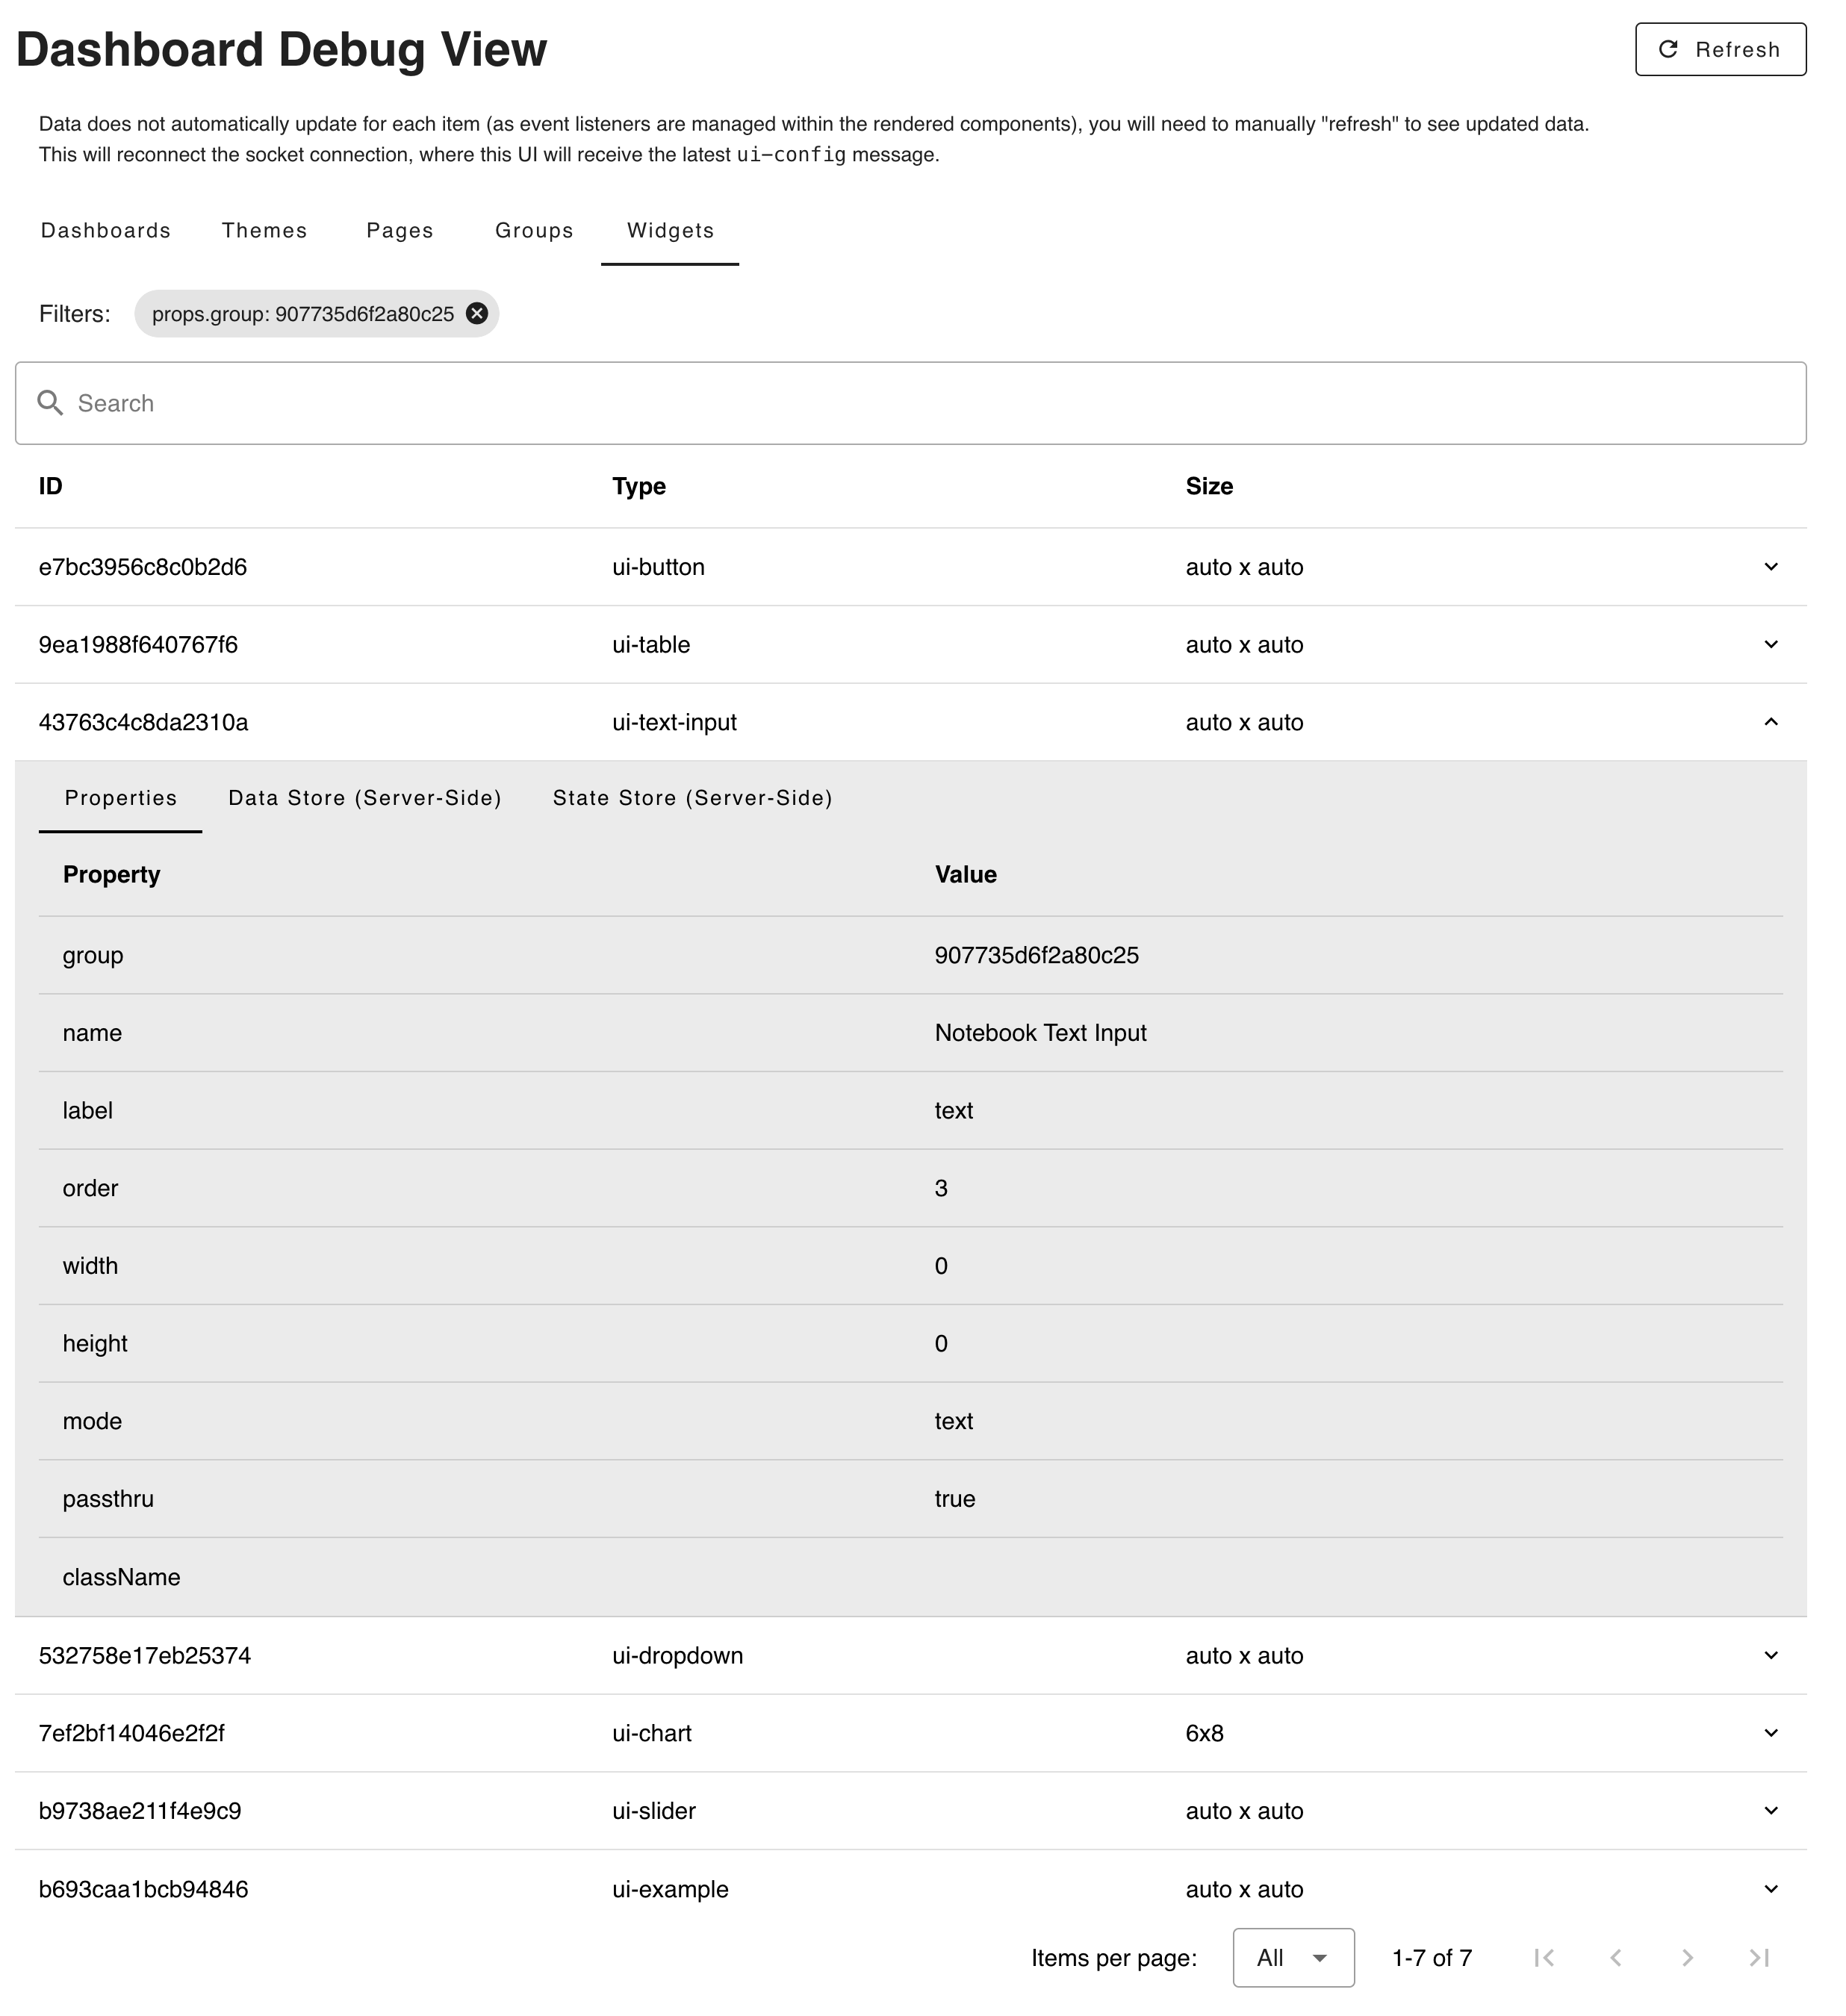
FlowFuse Dashboard comes with a built-in debugging tool to understand the data being configured for each dashboard, page, theme, group and widget.
To navigate to the tooling, head to <your-host>:<your-port>/dashboard/_debug.
 Screenshot of the FlowFuse Dashboard Debugging Tool
This tooling is particularly useful when you're building your own custom integrations, and developing on core Dashboard widgets too.
We're hoping to grow some of the scope of what this tooling provides, but for now, it will display the current props for a given widget, which is defined by Node-RED configurtion, but will also include the overriden values from the msg object (e.g. msg.options can override the Options property for a ui-dropdown).
Message History
 Screenshot of the "Message History" tab for a widget
This tab will show the latest msg values that the associated node has received in Node-RED's datastore for a given widget.
This is useful to understand what data will load when a new client connects to Node-RED. It will need refreshing to reflect the latest state if you're expecting new messages since the debug tool was last opened.
Dynamic Properties
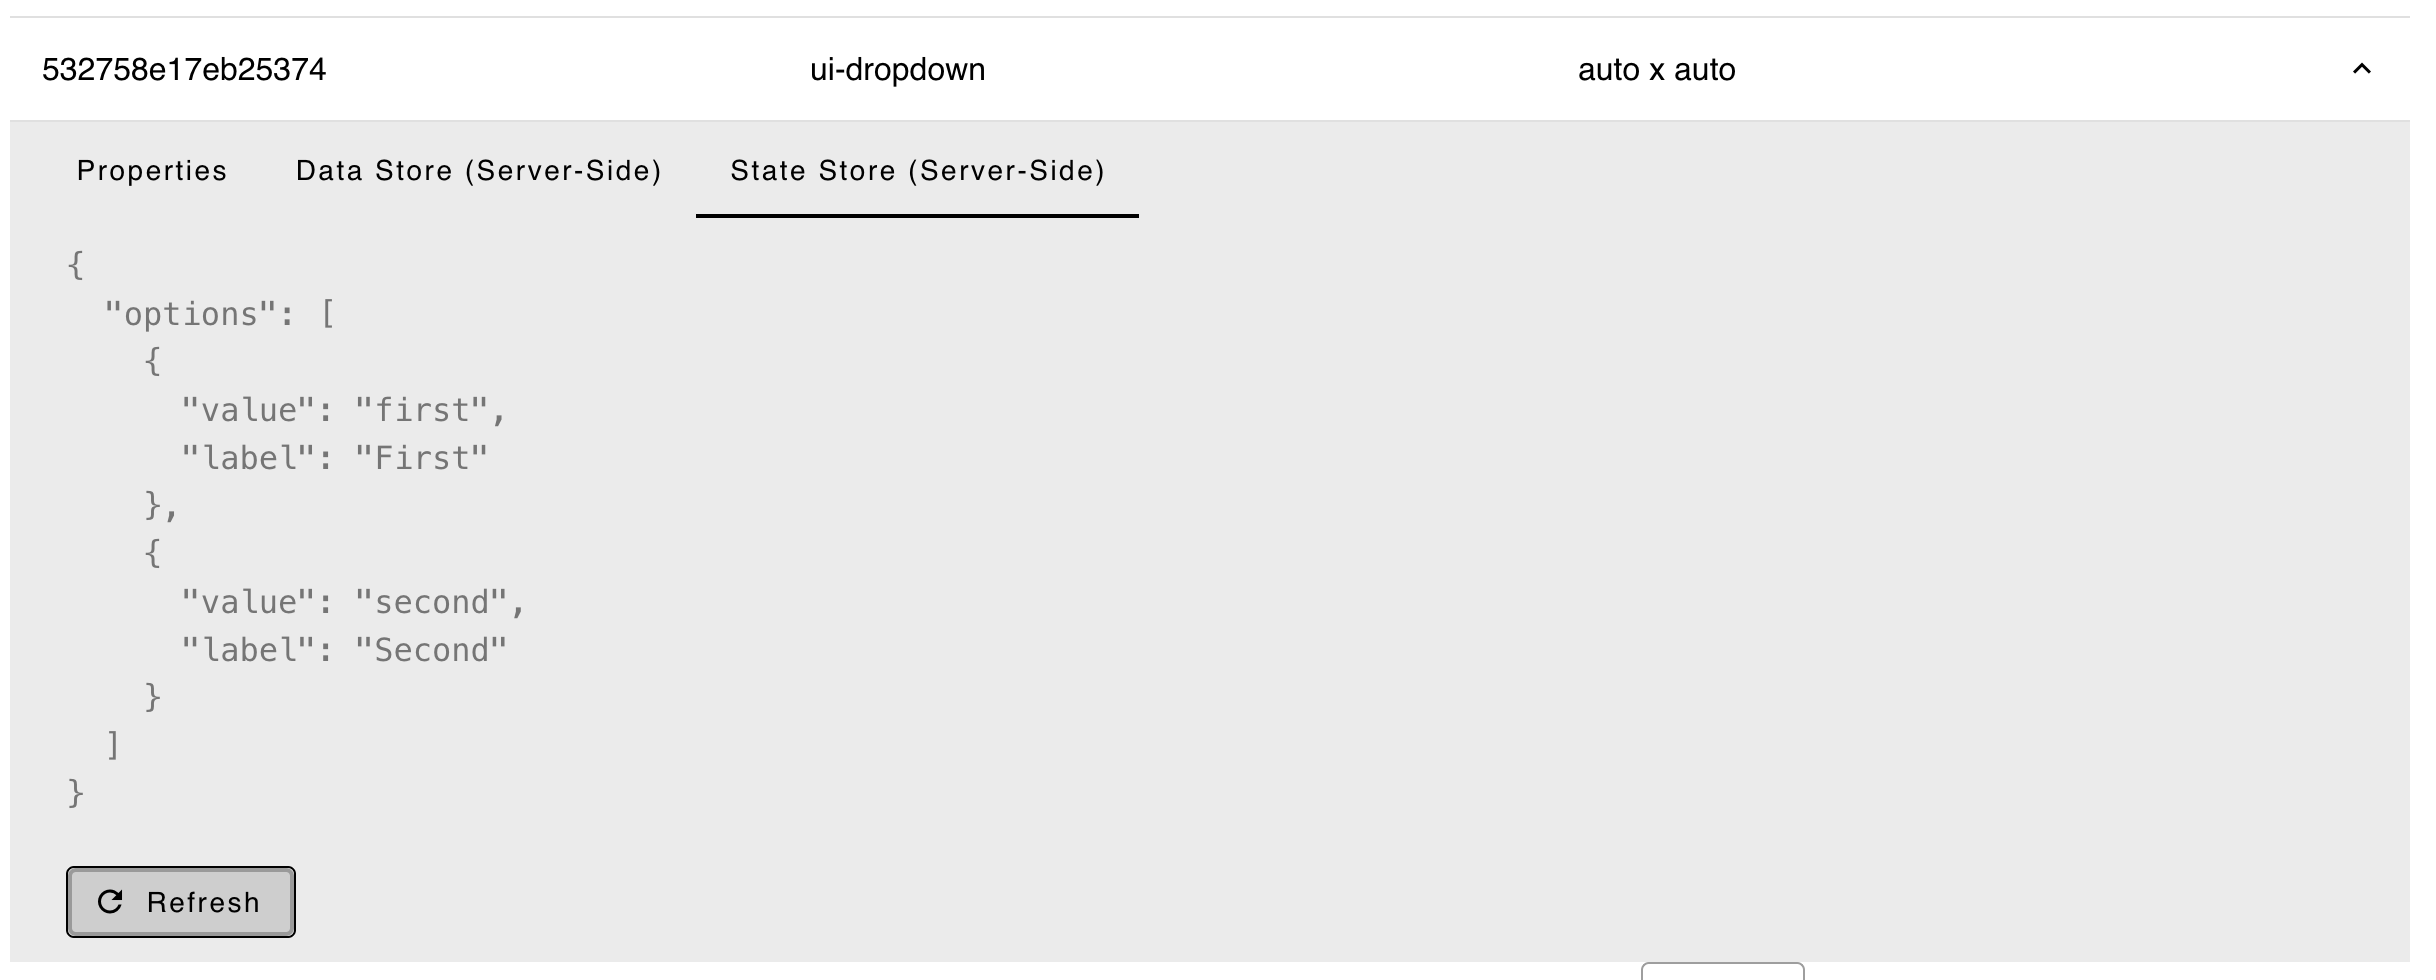
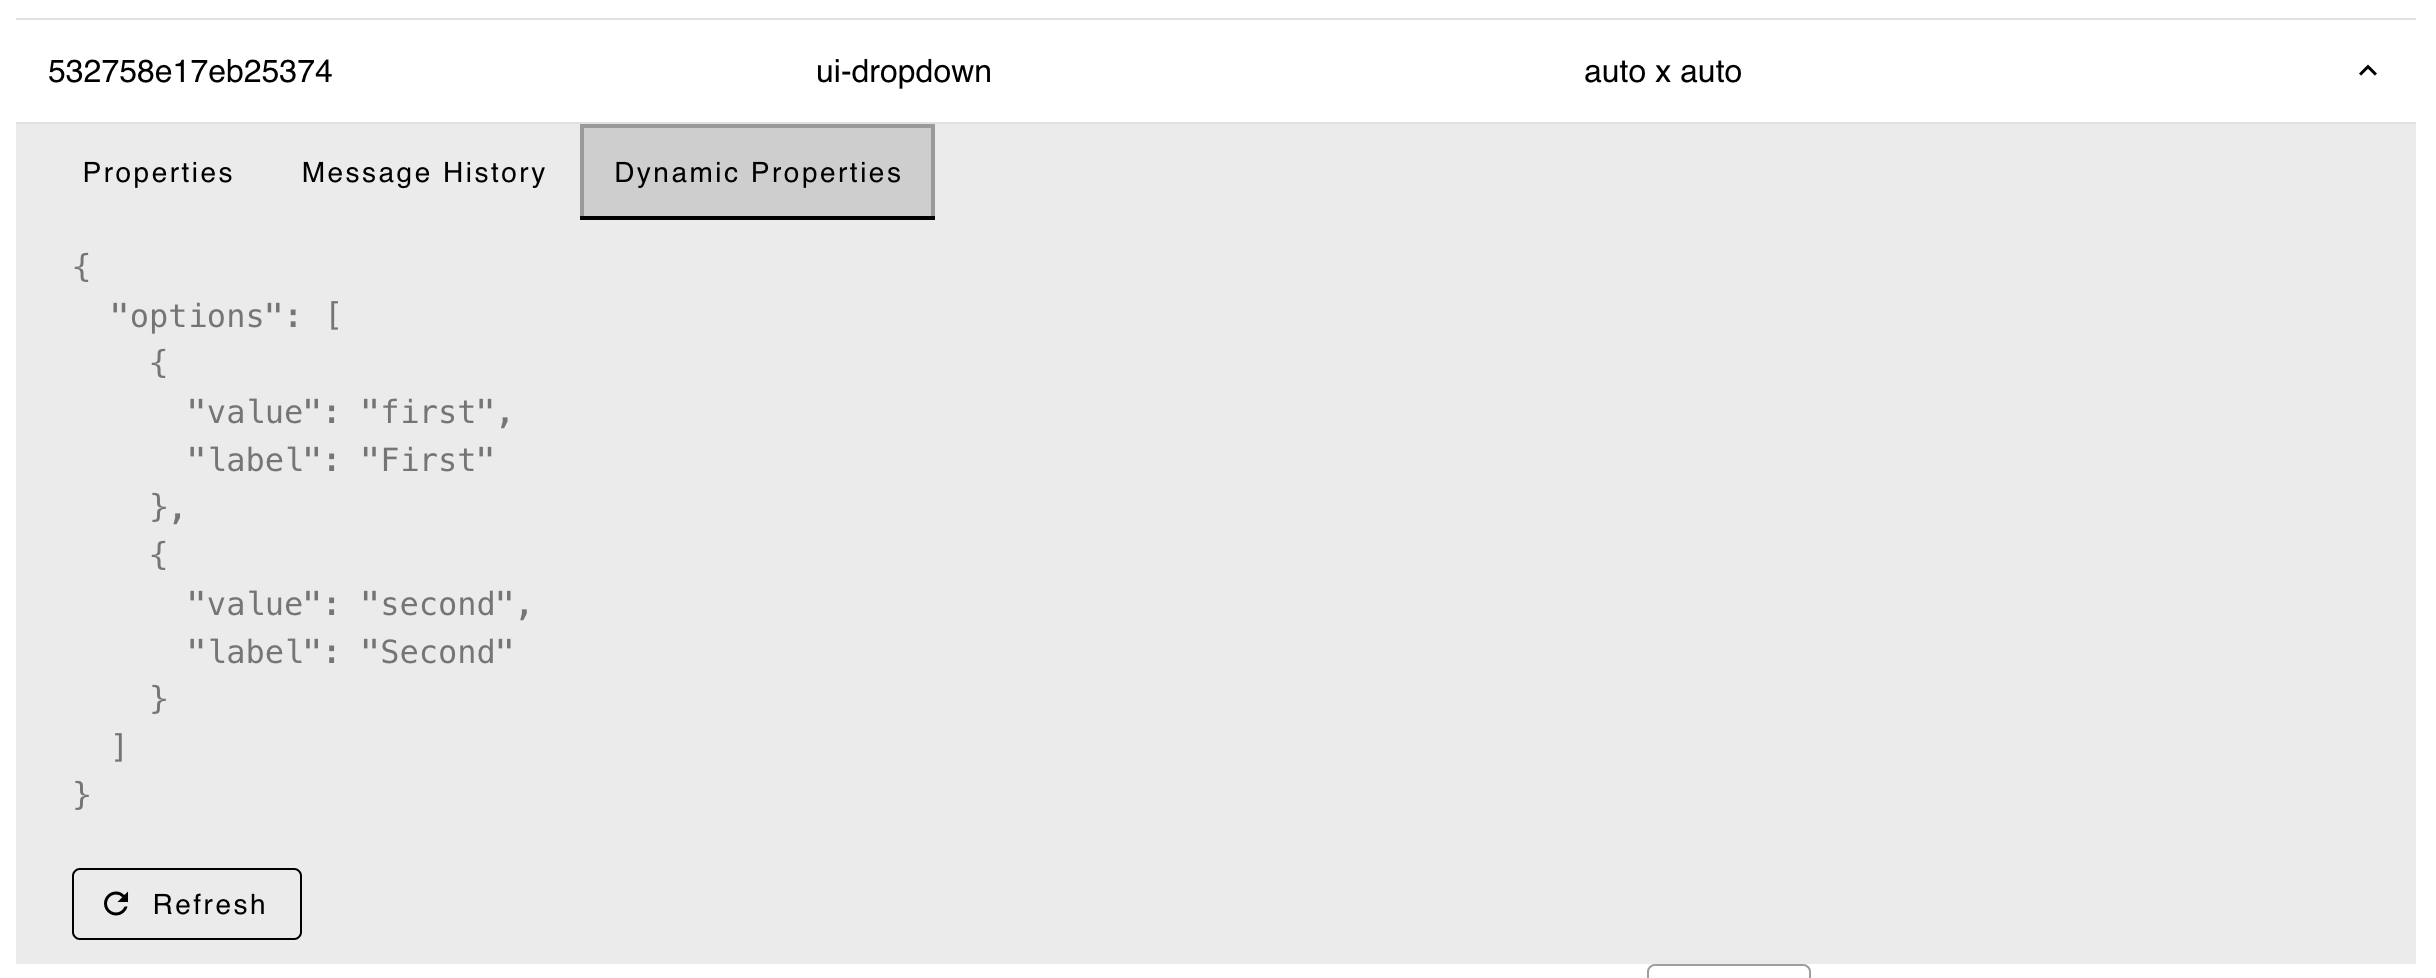
 Screenshot of the "Dynamic Properties" tab for a widget
This tab shows any dynamic properties (properties set with an injection of a msg.<property> that have been set since the Node-RED server has been running. Within our server-side architecture, these are stored in our statestore.
These values are generally overriding the default properties set within the Node-RED Editor, and can be used to sanity check why a particular widget renders the way that it does.
